Some questions deserve an answer
Did we put in a low?
Is a new trend on?
is it just a pullback and the downtrend will resume?
Introduction
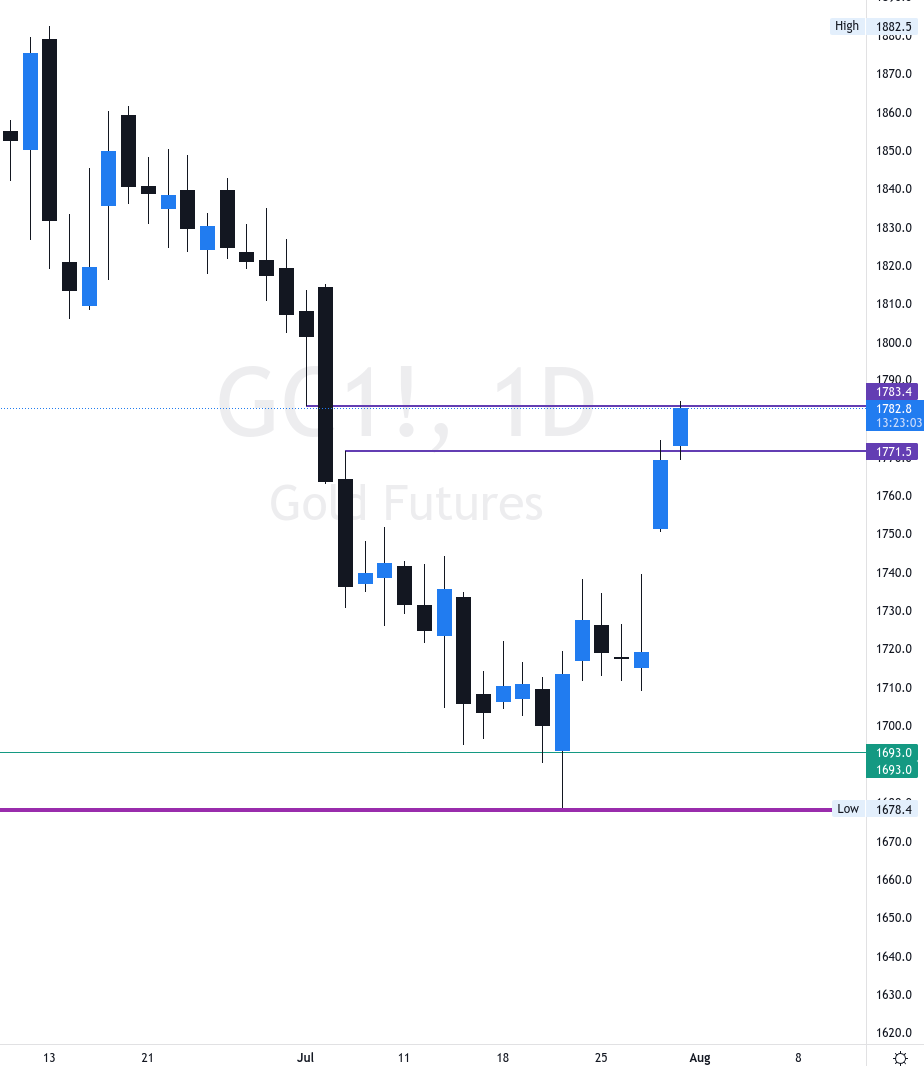
Gold has been on a run after hitting the 1678 multiday bottom, targetting the daily FVG (Fair Value Gap) in purple 1783.4 - 1771-5, as shown in the chart below.

The big picture
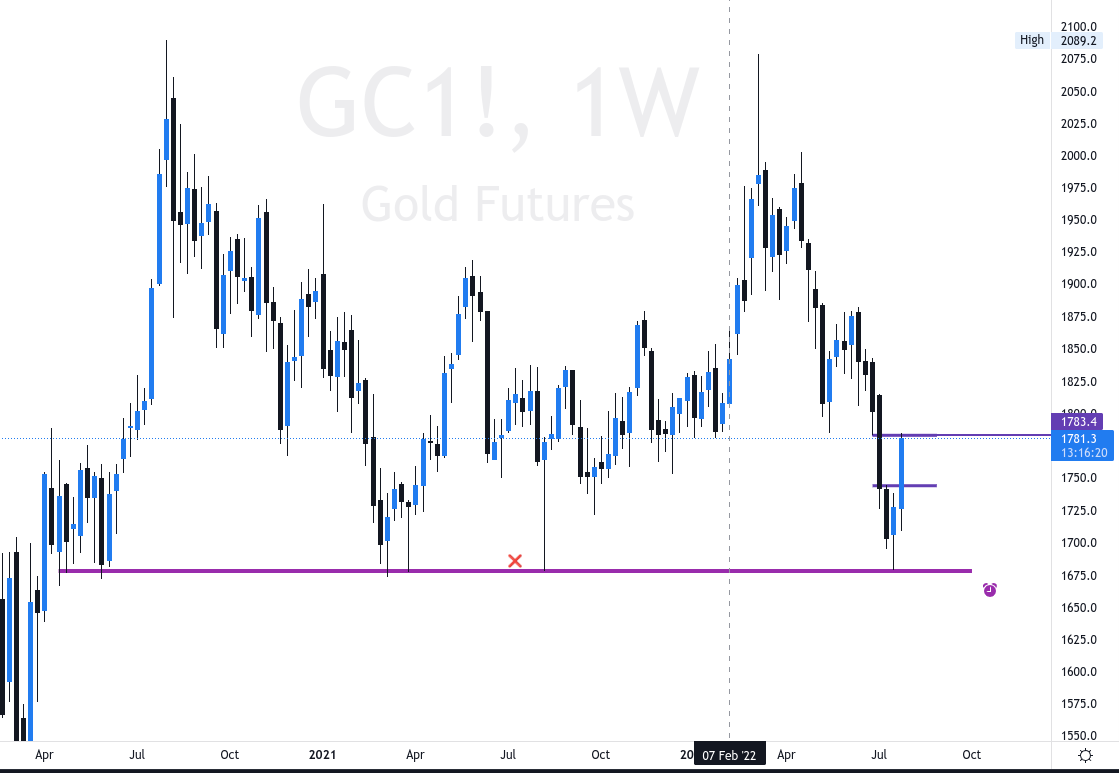
Let’s check the weekly chart to have an idea about the big picture
Observations
We can clearly see the consolidation of gold, we run up during the covid crash August 2020 with a short squeeze and hit $2089.
We have revisited the ATH around $2078 during the increase of inflation in Mars 2022, but bulls couldn't break the high
After putting a high, gold has been cooling off and came back to the same old weekly bottom of 🎯 $1678
Now from the perspective of liquidity, everyone was buying against the $1678 putting 6 weekly bottoms at that low, this “support” to my eyes is becoming weaker and hides a huge amount of liquidity resting beneath it. Therefore, bulls want to protect the $1678 and bears want to take that level so bad.
Following recent price action, I see Gold filling the gaps and grabbing resting liquidity $1744-1793.4, this is not a bullish action YET unless we break the $1875 pivot on the weekly timeframe, let’s see how the price reacts around 1783 and this is the gate toward $1800+ levels. Consequently, the low is not in yet.
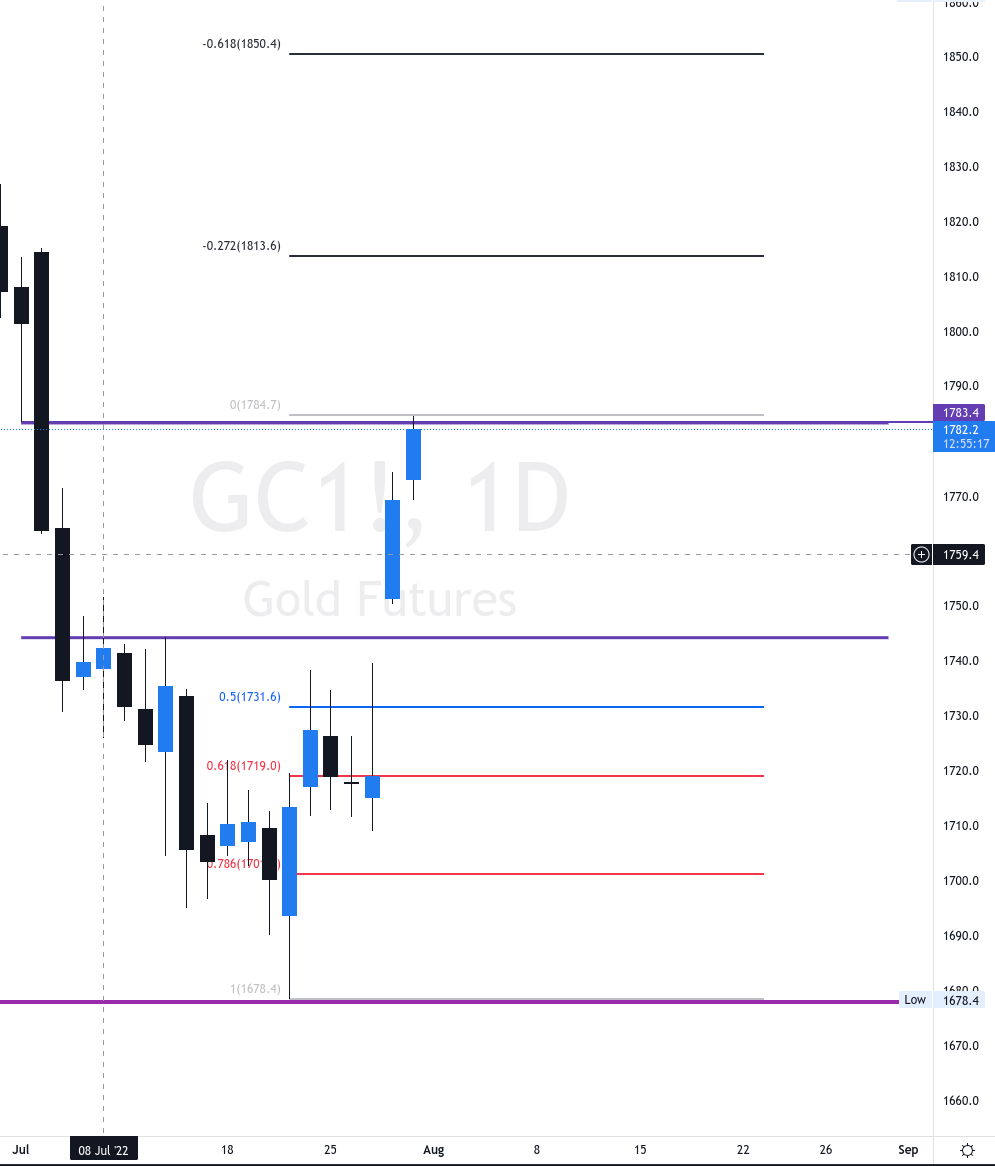
In the coming days, I am excepting Gold to pull back after a +6.25% run to cool off and see what it wants to go from there. The Fibonacci tool on TradingView provides an interesting projection of price, I will pay attention to the reaction of price @ these levels.
Gold lost its “inflation hedge” property as we live in a high inflation period. From the chart, we can see that the price of Gold is not behaving as a hedge at all. Some analysts talk about a very “most manipulated market”, I leave it there, we only use candles to interpret this market.
There is my comment regarding the gold chart, I hope this brought some light to your analysis.
Like & share.
Take care.
Amine.
Disclaimer: This newsletter is not trading or investment advice, but for general informational purposes only. This newsletter represents my personal opinions which I am sharing publicly as my personal blog.


